Analyse Performance
EasyForm makes field service management processes visible to everyone in organization. Visibility of online reported data create opportunity of analyzing performance of various KPIs, SLAs and deliverables.
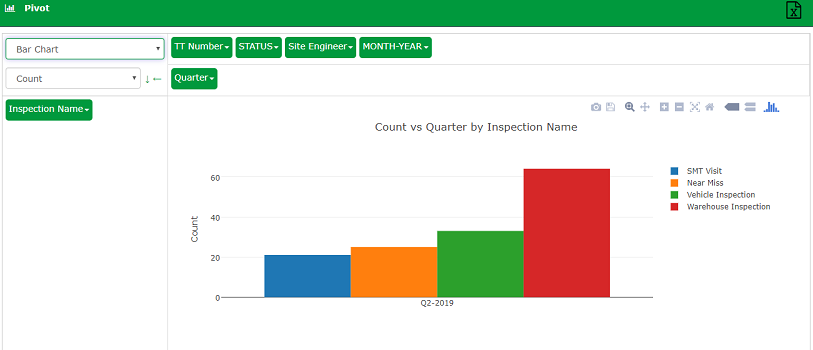
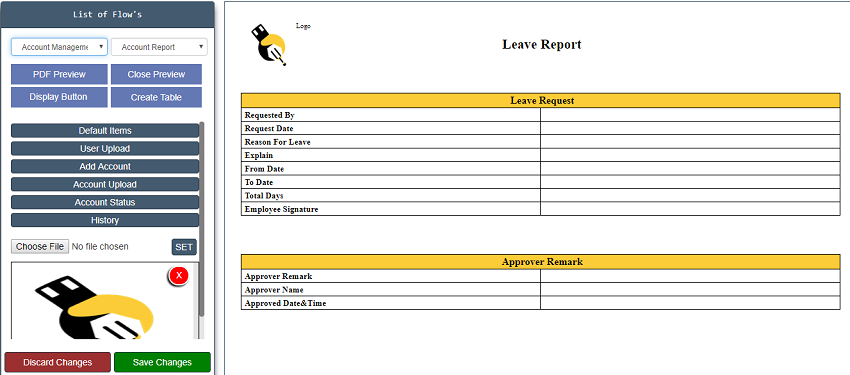
EasyForm report makers allows users to customize reports and charts them self. Users can access data depending on defined eligibility criteria by admin. E.g. area manager will have right to view and analyze reports and charts on area belong to him only. While Zonal head would have visibility of multiple areas managed by area managers reporting to him. Charts pivoting functionality helps users to generate and view data with various interlinking and relationships. Trending and customized dash boards gives long term and immediate performance view.
EasyForm supports customized Excel and PDF reports. Built in report creation tool can be used to make customized reports. PDF report can have photos and video embedded in to report. Excel and PDF reports can be exported for offline analysis and sharing.
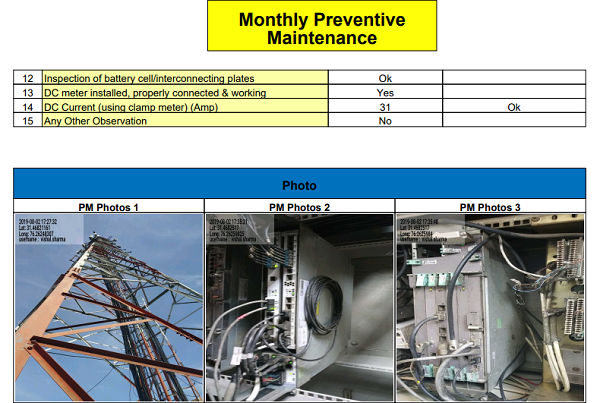
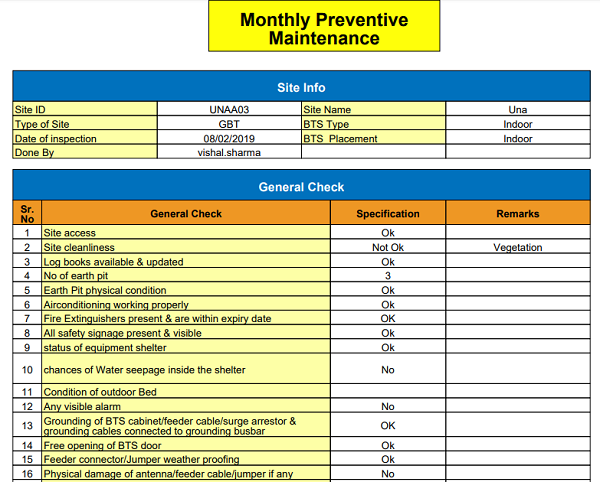
EasyForm supports some of the standard field service reports. Mainly these field service reports are related to how various task are being handled and when those tasks are closed as well as who takes how much time in executing specific tasks. Visibility of pending task and TAT violated tasks helps identifying and fixing various delays. Visibility brings discipline and accountability in field service organization.
RECORD TRAVEL DISTANCE
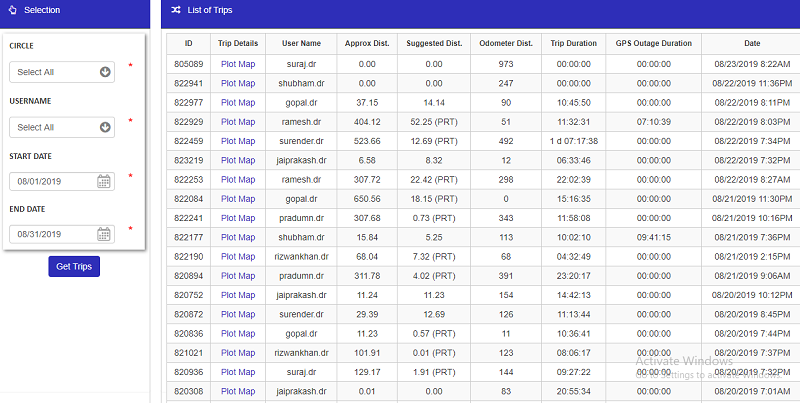
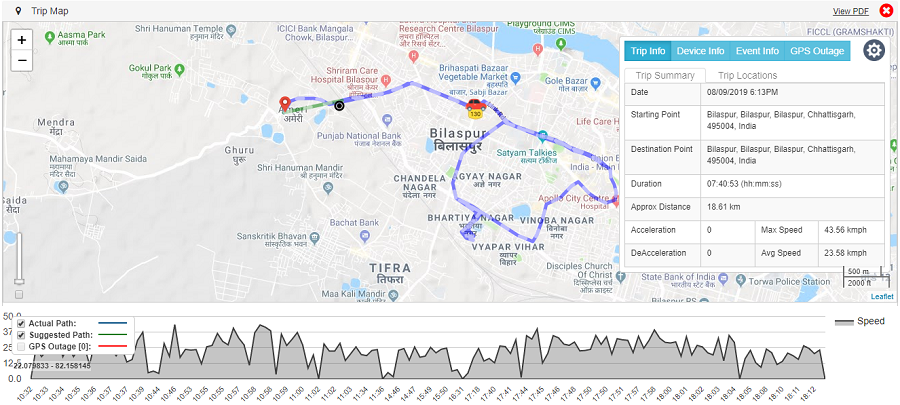
When you know how much employee has travelled, you can use this data to calculate Travel Allowance, and establish best practices for training purposes.
GET THE FULL VIEW
EasyForm keeps logs of every task, location of each user. Reporting tools helps you to understand various trends and analyze performance of specific field person. Pending task report tells you what is still in pipe line and what is not getting competed in time. Task wise or user wise analysis are useful for setting performance bench mark and measuring against target.